
What is the marginal abatement cost curve?
The Marginal Abatement Cost Curve (MACC) compares the cost-effectiveness of different carbon emission reduction strategies, ranking them by profitability to help prioritize climate actions and inform carbon market targets for investing in green technologies, though results depend on assumptions and technological advancements. It helps policymakers and businesses decide which measures to implement to achieve environmental goals efficiently and cost-effectively for investing in sustainable development.

The Marginal Abatement Cost Curve (MACC) indicates how profitable it can be to invest in more sustainable technologies.
It all starts with the abatement cost
The abatement cost is the expense required to reduce one additional tonne of CO2 emissions. It includes all costs associated with implementing a particular intervention, while subtracting any future financial savings that result from this emissions reduction.
See how Homaio Comply handles EU ETS compliance.
Discover Comply
Comparing the green profitability
The Marginal Abatement Cost Curve (MACC) is an analytical tool that compares the cost-effectiveness of various strategies for reducing carbon emissions. Then, it ranks them according to their profitability - which actions are easiest and most effective to implement first?
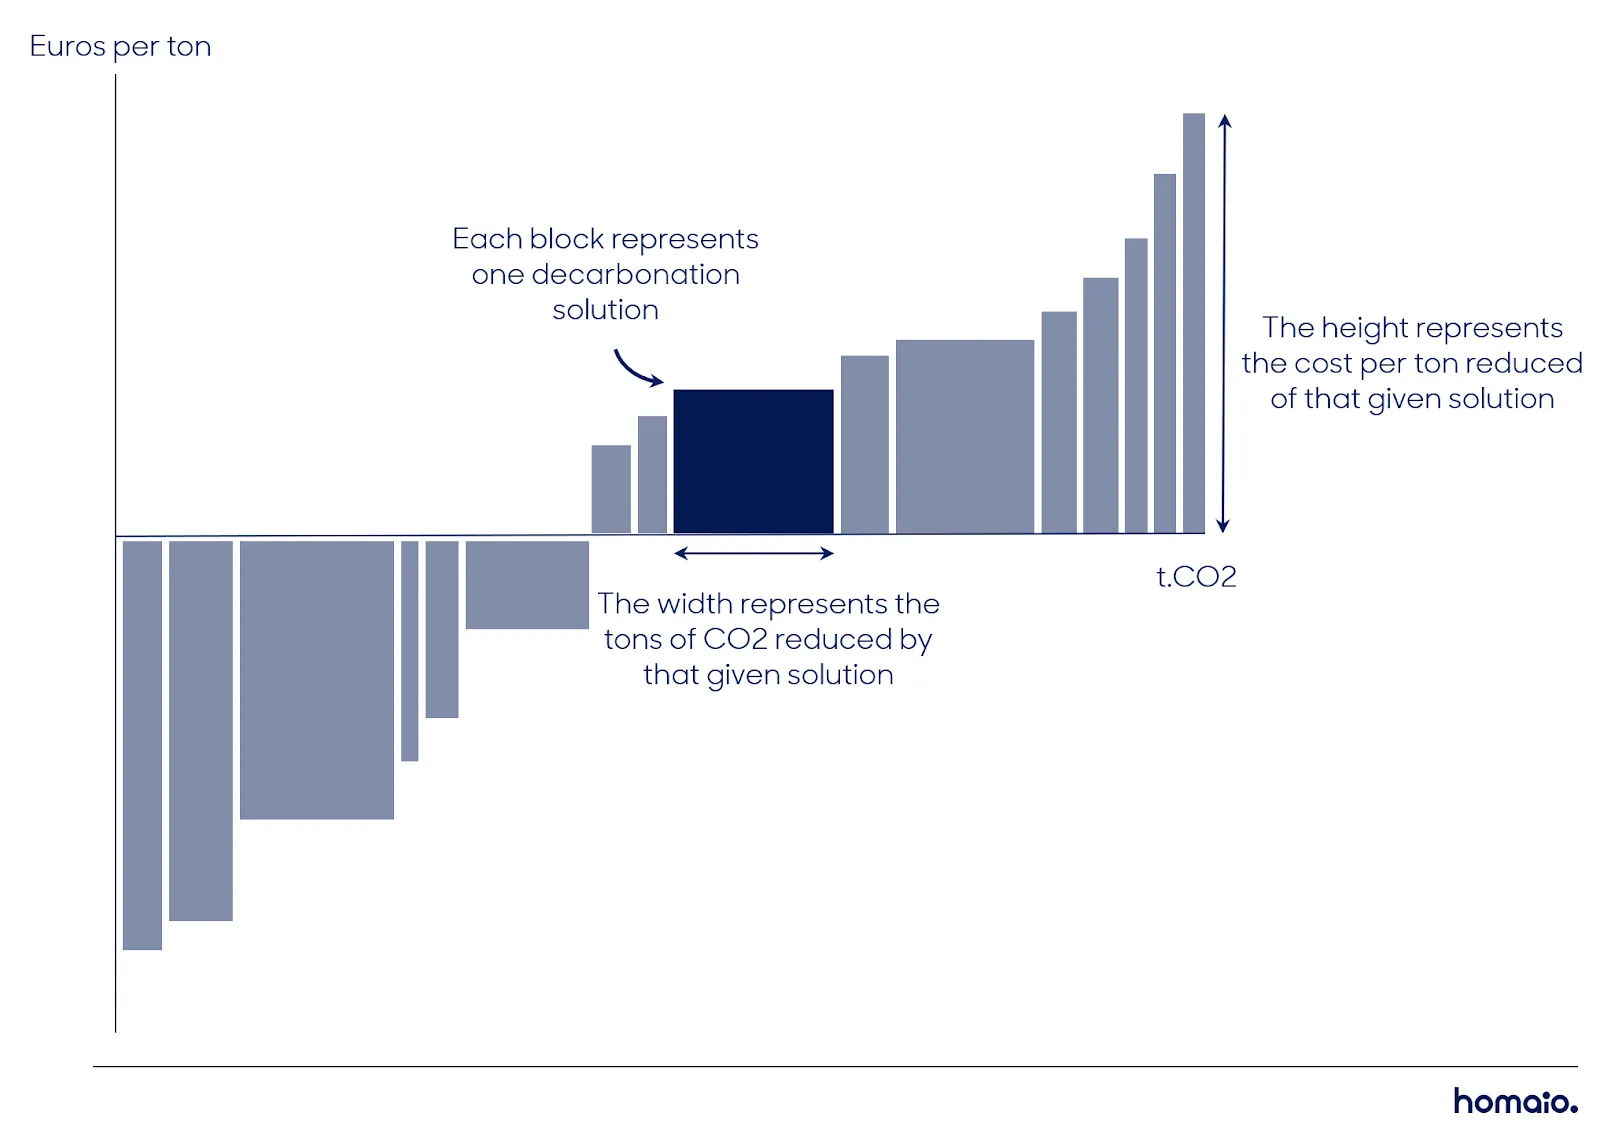
A simple example for a complex matter
To illustrate, consider replacing a gas boiler with a heat pump. This intervention reduces CO2 emissions but involves some costs for installation and ongoing electricity use. The abatement cost is calculated by dividing the total additional costs (installation and electricity) by the amount of CO2 emissions avoided. This value can be either positive or negative, depending on whether the intervention results in a net cost or savings.
The purpose of the Marginal Abatement Cost Curve
The MACC helps to prioritize climate actions by comparing the relative costs of different emissions reduction options. By plotting these options on a curve, the MACC visually represents which measures are most cost-effective. It clearly shows that interventions with negative abatement costs are already economically beneficial, as they provide savings while reducing emissions. Then, when in positive territory, the lowest abatement costs show the opportunities to reduce emissions at minimal expense.
The MACC is important for carbon markets
When it comes to emissions trading schemes, the marginal abatement cost can be a useful tool for setting effective targets in terms of carbon prices. When the price of carbon allowances increases, it becomes more attractive for businesses to invest in technologies that reduce emissions rather than just buying allowances. By showing the relative costs of various reduction strategies, the MACC helps set carbon prices that encourage the adoption of greener technologies and drive more effective emissions reductions.
See how Homaio Comply handles EU ETS compliance.
Discover Comply
There are limitations to the Marginal Abatement Cost Curve
However, the Marginal Abatement Cost Curve (MACC) is not an absolute measure and does not offer all the answers. Its results depend on various assumptions made during calculations, leading to different outcomes. Also, as technological and scientific advancements occur, the curve can change rapidly. Such developments are interdependent, meaning that as certain technologies become more widely adopted, the MACC may shift. Despite these limitations, the MACC remains a valuable tool for guiding climate action at our current stage in the global fight against climate change.
The MACC enables policymakers and businesses to make informed decisions about which measures to implement to achieve environmental goals efficiently and cost-effectively.