Blog
Carbon Market
Is the EU ETS a volatile market?

Is the EU ETS a volatile market?

EU carbon allowances (EUAs) exhibit moderate short-term volatility due to demand-side factors, but their declining supply supports long-term price appreciation, making them potentially suitable for long-term sustainable investment strategies. Increased market participation can further stabilize the EUA market.

European Union Allowances (EUAs) are a moderately volatile investment asset. In the short term, their prices can experience fluctuations due to the various demand-side factors. However, over the long term, the trend becomes clearer: carbon allowances are designed for price appreciation.

The supply side stability

On the supply side, the European Union Emissions Trading Scheme (EU ETS) is relatively stable and does not contribute much to market volatility. The total number of carbon allowances available is predetermined by the EU's regulatory framework and is set several years in advance. The cap on emissions and the auction calendar are established well ahead of time, which provides a clear and predictable supply of EUAs. This stability mitigates potential volatility that could otherwise come from the supply side of an investment asset.

[[cta-nl]]

Demand side factors

In contrast, the demand side of the EU ETS introduces more variability. Several factors influence the demand for EUAs, like fluctuations in energy prices, weather conditions, and shifts in energy production sources. These factors can cause short- to medium-term volatility in EUA prices. For example, a sudden increase in energy demand due to colder weather can drive up EUA prices as industries require more allowances to cover their emissions.

Short-term trading behavior and volatility

Short-term volatility can also arise from trading behaviors, especially around significant dates such as the expiry of options or futures contracts. Traders' actions around these events can lead to intra-day or intra-week price swings. However, this type of volatility is short-lived and does not fundamentally alter the broader trends in the EUA market. 

EUA volatility and other assets

The EUA volatility is seen as moderate, especially when compared to other asset classes. In 2023, the 90-day average volatility of EUA daily returns was approximately 2.24%. This level is relatively low when compared to commodities like natural gas or coal, which can experience more significant price swings. However, EUAs are more volatile than traditional financial instruments such as government bonds, which are known for their stability.

Market participation stabilizing the EU ETS

The volatility of the EU ETS can be improved by the growing number and diversity of market participants. As there is more participation like the one of private investors entering the market, the trading volumes become more distributed across various investment horizons and strategies. This diversity can help to reduce market volatility, as large, simultaneous transactions are offset by different investing profiles. Increased participation by a broader range of investors can thus contribute to a more stable market environment.

[[cta-discover]]

EUAs may be volatile in the short to medium term, but their fixed declining supply supports long-term price appreciation, making them suitable for long-term investment strategies.


Share this article :

Learn more

Carbon Market

UKAs and EUAs: Why Hold Both When You're Already Invested in European Carbon

If you're already invested in European EUAs, do you need to bother with UK UKAs? Short answer: yes. Long answer: the two markets are correlated at around 80% over time, but that correlation hides distinct dynamics (political, industrial, calendar-based) that make UKAs both linked and differentiated from EUAs. That's precisely what makes the combination interesting: an EUA core for liquidity and depth, a UKA satellite for political catch-up and the associated risk premium. Here's why.

July 13, 2026

Carbon Market

What is the Climate Impact of a UKA? One Tonne of CO₂ Pulled Off the Market, Measured and Verifiable

Holding a UKA does something simple and radical: it takes one right-to-emit tonne of CO₂ off the UK market. Not an offset, not a voluntary credit, not a tree-planting promise. A regulated allowance, accounted for by the State, that exits the system the moment a non-compliance investor holds it. It's what we call an additional climate action: measurable, verifiable, legally framed. Here's how it works, and why this impact is one of the most robust in today's climate-finance landscape.

July 13, 2026

Carbon Market

The UKA-EUA Convergence Play: Anatomy of a Catch-Up in Motion

May 2025, London summit: Keir Starmer and Ursula von der Leyen formally state their intention to link the UK ETS to the European system. A new term has been circulating among carbon analysts ever since: the Convergence Play. The mechanic is simple: UKAs trade today around 20% below EUAs, a discount that has already partially closed since May 2025. The residual mechanical upside is around +20 to +25%. Here's how it works, why it's happening now, and what the Swiss-EU precedent teaches us.

July 13, 2026

What if your savings funded the climate transition?

Homaio is the first platform that allows you to invest in European (EUA) and British (UKA) carbon quotas.

Diversify: integrate climate assets into your portfolio.
Discover Homaio
Finally access investments that combine
financial
 and
environmental
 performance
The Guide to Climate Investing

Investing in the climate without sacrificing performance: an accessible guide to understanding it all.

Thank you! Your submission has been received!
Oops! Something went wrong while submitting the form.
Free guide
The guide to investing in UK carbon allowances

Understanding the UK carbon market and its potential for investors.

Thank you! Your submission has been received!
Oops! Something went wrong while submitting the form.
Free guide
Newsletter
The Homing Bird

5 minutes a week to become unbeatable on climate finance.

Thank you! Your submission has been received!
Oops! Something went wrong while submitting the form.
Simulate your return in 2 clicks

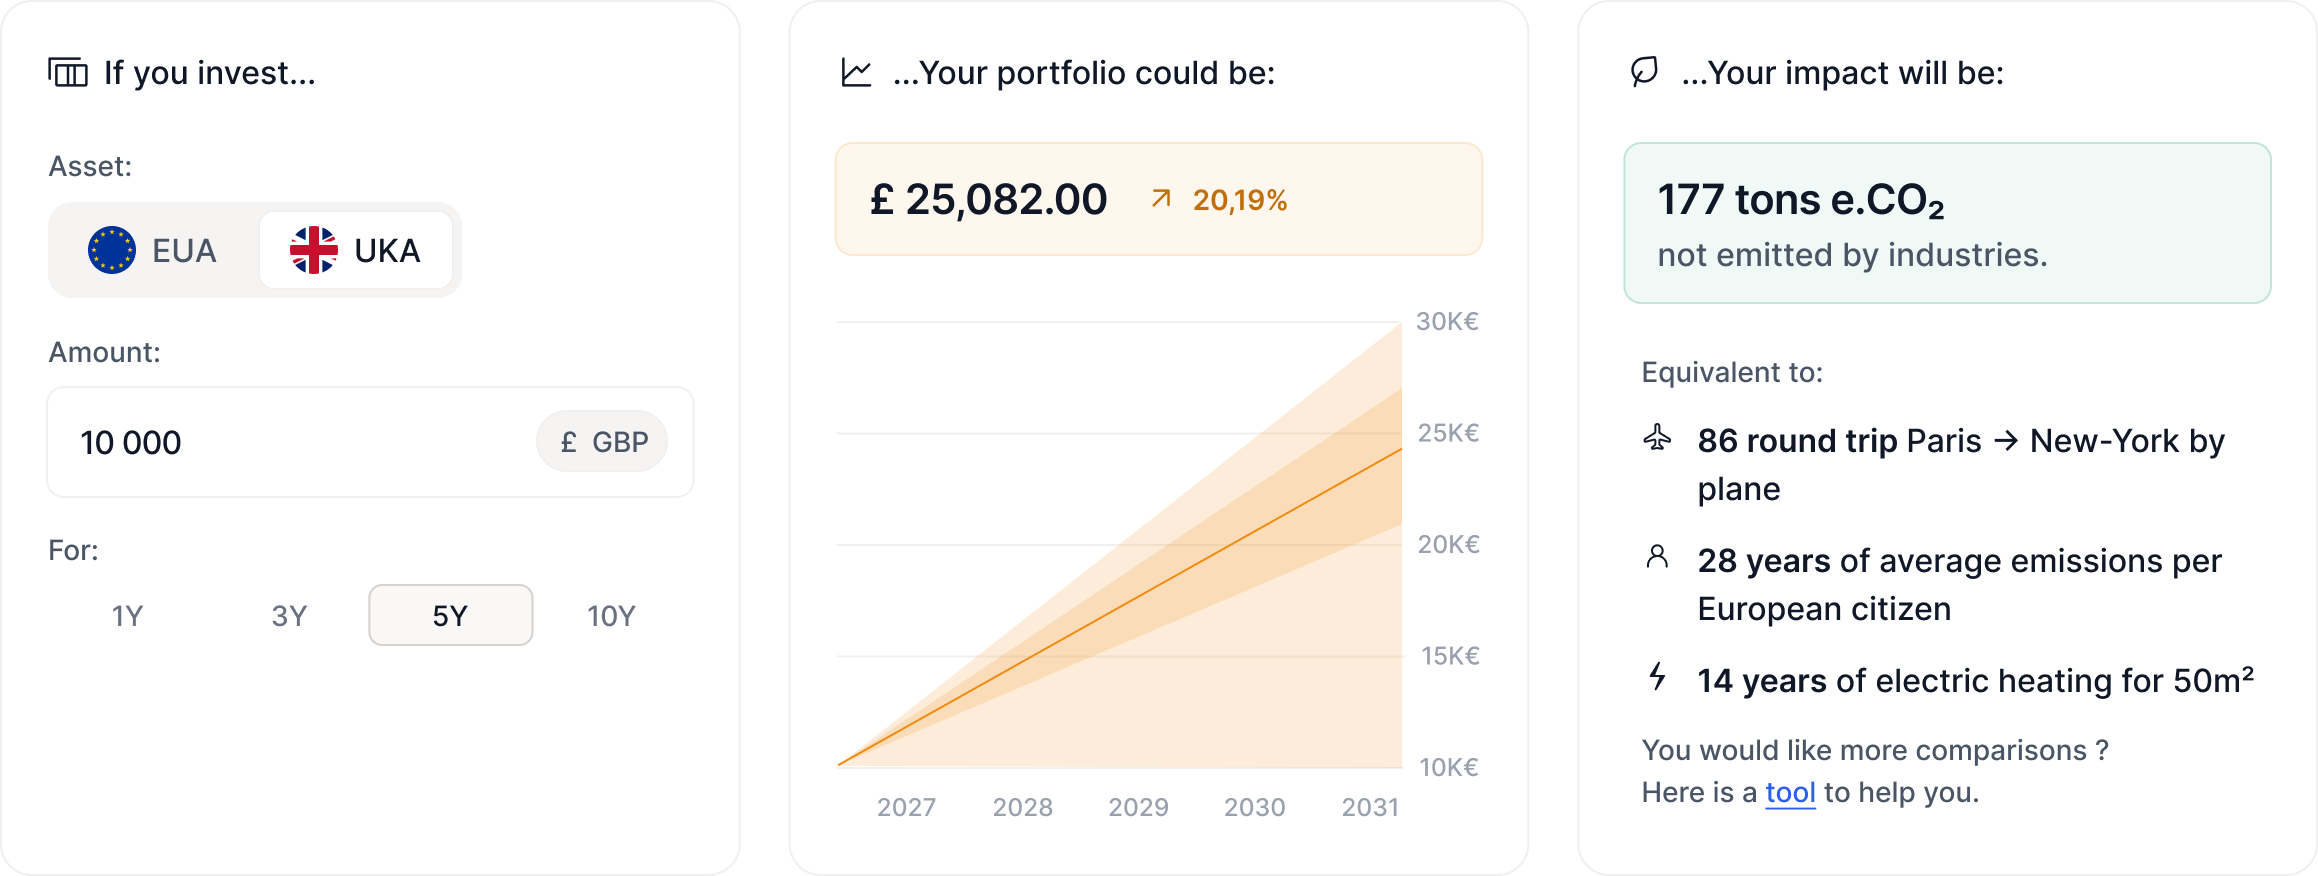
Discover the added value you could have achieved if you had invested in one of our assets 1, 5, or 10 years ago.

Chat with an expert

Need help or more information? Schedule an appointment with our expert, who will be delighted to assist you!